Quantcast
Channel: Telerik Blogs | .NET
Viewing all 1954 articles
Browse latest View live

.NET Ninja Tooling Arrives—Shipping the Telerik R3 Release

$
0
0

It's here—the Telerik R3 2017 release has landed, packed with new features and updates for your favorite UI tools and components. Read on to see what's new.

We are closing off our last release of the year with a big bang. To make you more productive, we are shipping 10 new controls across all UI frameworks. We've enhanced Document Processing Library with advanced PDF manipulation options, introducing new themes and various analytics integration capabilities. In addition, we've expanded our existing components with more features and customization options. Most of all, we are further enhancing product support to allow for your specific needs.

You are probably interested in seeing all the features we are shipping for each individual platform. Dig into the specific team blogs and product pages to learn more:

  • Full support of ASP.NET Core 2.0
  • Theming support in Xamarin, in addition to a brand-new Grid CTP component
  • New RadVirtualGrid from for WPF
  • New Spreadsheet component from our WinForms
  • RowDetails support in RadDataGrid on UWP
  • Reporting gets boosted performance & accessibility (WCAG 2.0 support)
  • And our brethren Kendo UI gets support for React and Vue

If all you want is the hardcore product facts, you can stop reading right here. But there is more!

We are investing heavily across the board and we believe it shows—just glance at our what’s new page or download the latest bits. We are also “shipping” a new look for the .NET Ninja mascot! A substantial product release like R3 2017 and the ongoing investment had to be paired with a new look. The new .NET Ninja exemplifies the ongoing commitment we have for all our fellow .NET developers. The .NET Ninja is also in better shape than ever and ready for action. This is what you can expect from us: the modern UI, fast releases, awesome support, productivity and ease of use you’re already used to—just better. Hold me accountable to it!

En route to making you a better .NET Ninja, we are also making all the UI tooling available to you via a single UI bundle, called DevCraft UI for just $1299.  It now includes our UI for Xamarin controls, which was previously available only in DevCraft Ultimate. Now you have all the tools at your disposal when developing striking apps for Web, Desktop or Mobile. Moreover, you now have multiple technical support options (Lite, Priority, and Ultimate) to suit your specific needs.

And what would a product release be without a flashy webinar—right? Here are two webinars to check out:

  • Telerik: October 11th. Register here.
  • Kendo UI: September 28th. Register here.
  • Don’t have time to attend—why not take the tools for a spin now then at the link below?
Start a Free Trial Now

What's New in Telerik Reporting and Telerik Report Server R3 2017

$
0
0

New Financial Charts, web viewer accessibility, better performance for Excel rendering, memory optimizations for PDF rendering and bug fixes make the new R3 2017 release irresistible.

The R3 release of Telerik Reporting is now live and we are ready to brag about all of the goodness we have to share with you.

Web Report Preview Accessibility

All of the HTML5-based report viewers (jQuery, MVC, Angular 2+ and Web Forms Report Viewer), now support major accessibility features like comprehensive keyboard navigation in both the viewer and its content, and dynamically extended markup that provides support for most of the popular screen readers.

Our goal is to provide a reporting solution that is accessible to a wider audience, including users with motor control restrictions who may need to work with assistive technologies. We follow the recommended practices in Section 508 of the Rehabilitation Act and the Web Content Accessibility Guidelines (WCAG) 2.0 Level AA to the greatest extent possible.

OHLC Chart

The OHLC chart displays a series of candlestick or bar markers that represent information about price movement. The marker can be colored depending on the movement of the price for this period—if the close level is lower than the open level, it's recognized as a bearish pattern and the color or the fill or the marker changes so it can be distinguished from the bullish pattern, where the close level is higher than the open level.

More Performance Improvements

In this release we have significantly improved Excel rendering by introducing a better algorithm for the Excel grid generation. This improvement can decrease the rendering time multiple times over, depending on the report. The bigger the report is, the bigger the improvement.

In the case of the popular PDF format, we have focused mainly on memory optimizations. The report engine now handles PDF pages continuously, enabling us to release .NET objects that keep page structure immediately after the page is rendered. This optimization reduces the memory allocation when rendering big PDF reports.

Crosstab is an essential report item and in this release, we have improved the crosstab generation algorithm. Now even big crosstabs will be prepared in a reasonable amount of time.

Data Schema from the Report Server

The Standalone Report Designer doesn't need direct connection to the SQL data source. Instead the designer requests the database schema, data models and preview data from the Report Server. This way the report author doesn't have to install ADO.NET data providers, or to request DB permissions. The connection string is kept on the server and will not be exposed to report authors without data source creation rights.

Eliminated Bugs

For the full list of all the bug fixes, check the release notes for Telerik Reporting and Telerik Report Server.

Try it Out and Share Feedback

We want to know what you think—you can download a free trial today and share your thoughts in our Feedback Portal, or right in the comments below.

Build Once Deploy Everywhere with Progress Telerik Reporting

$
0
0

Reporting solutions can supply powerful functionality for your reports. Here's a tip on how to use one to create a report once and present it anywhere.

In this blog post, I'd like to talk about one of the key benefits of using a reporting solution for reports. This is the flexibility of authoring reports just once, and then presenting them in a variety of application frameworks and document formats.

In the core of our report engine is the declarative definition paradigm. Most programming languages define what something is and how to do something. The report definition describes what the output will look like and where the source data is coming from. This leaves the application free to decide how to generate the defined look and feel, regardless of the programming language or underlying architecture. The benefit is easy coding free option to create impressive reports with a data-driven report layout.

In order for the declarative model to work, a mature designer is needed. We do have not one, but two options:

  • Standalone Report Designer for a code free report authoring experience, so even professionals with basic data operations knowledge can design reports.
  • Visual Studio integrated Report Designer for all .NET ninjas.

Once the report definitions are ready, the reporting engine combines it with the provided data and cuts the generated items into pages, which then outputs it in the target document format. This can be any of the popular document formats: PDF, HTML, Excel, Word, RTF, XPS, PowerPoint, TTF, CSV, EMF and various image formats.

The rendered document is presented in a document viewer or in one of the available dedicated report viewer widgets. Telerik Reporting provides a variety of report viewers for popular application frameworks like HTML5, Angular, MVC, WPF, WinForms, Web Forms and even for good old Silverlight. The benefit of using a native report viewer is to embed reports in the application and take advantage of awesome interactivity features like filtering with parameters, data drill-down, sorting, navigation within the report or to other reports or external URLs. All of this awesomeness comes out of the box and only needs a simple setup while authoring the report definition.

Based on the application technology used, we have different options for hosting the reporting engine. The engine is built with the .NET framework, so in case of the web technologies and non-.NET application frameworks, it's hosted on a service or directly used through the Telerik Report Server. The following options are available:

  • WCF Service for the Silverlight Report Viewer;
  • REST Service for all web and desktop viewers;
  • Telerik Report Server for all web and desktop viewers;
  • The embedded reporting engine in the .NET desktop viewers.

This concludes our short journey into the wonders of reporting solutions. Reporting solutions provide quick ways to make data visualizations from various data sources for previewing, printing, sharing and archiving. They can be a powerful ally when reports are needed.

Telerik Reporting

Telerik Reporting is an embedded reporting solution that can be easily embedded in your application. For more information see http://www.telerik.com/reporting.

Telerik Report Server

Managing a vast collection of reports may be challenging and therefore we have introduced the Telerik Report Server solution to efficiently store, create and analyse reports in a single server-side repository. Telerik Report Server leverages the feature-rich Telerik Reporting engine and supports all must-have report server features like scheduling, data alerts, versioning, report caching, authentication with AD FS support, ready to use report server web portal with enabled white labeling and complete REST API for integration with your desktop and web applications. For more information on the report server solution see: http://www.telerik.com/report-server

Are you ready to dive deep into the world of reporting? Start a free trial of Reporting and Report Server today and don’t forget that the free trial comes with free support.

How to Use ASP.NET Core TagHelpers

$
0
0

ASP.NET Core has gained a helpful new feature in TagHelpers. Stay up to date with the latest info and learn how you can use them in your apps.

Recently Microsoft announced the release of ASP.NET Core 2.0. With this release comes a new feature for building HTML views called TagHelpers. With ASP.NET Core 2.0 TagHelpers allow developers to write component based views for server side rendering by utilizing a syntax similar to HTML. This new syntax incorporates concepts used in HTML, elements and attributes.

When using TagHelpers in a .cshtml view, Visual Studio treats the TagHelper as it would HTML but with added server side functionality. Often with HTML Helpers the CSS class attribute was difficult to add, and completely lacked Intellisense. With TagHelpers, developers get rich Intellisense for not only server side code but also with any HTML attributes supported by Visual Studio.

In addition to better Intellisense, TagHelpers also make great container elements. TagHelpers treat their inner HTML content as normal HTML elements do. In comparison to HTML Helpers, nested content required escape codes, or specialized using blocks to contain inner HTML content.

Throughout .NET’s journey from conceptualizing ASP.NET Core TagHelpers to our recent release, Progress has continued to support the community by sharing information about TagHelpers. Below are resources that will help keep you up to speed on the latest developments with ASP.NET Core TagHelpers.

Building Reuseable Components in ASP.NET Core

Telerik UI for ASP.NET Core supports a variety of TagHelpers with more on their way. Try our TagHelpers with a thirty-day free trial of UI for ASP.NET Core.

Progress @ DEVintersection: Sessions, Product Showcases and Lots of Fun

$
0
0

DEVintersection is coming up! This October 31 – November 2, 2017 at the MGM Grand in Las Vegas, we invite you to join us at Booth 111. Hope to see you there!

Looking forward to DEVintersection 2017? So are we! There are bound to be some amazing announcements. We will be there too (booth #111), so make sure to stop by, meet the team and discuss the latest trends in tech, including our Telerik UI for Xamarin, Telerik UI for UWP, Kendo UI and Telerik Reporting. We have some cool SWAG too.

DEVintersection starts in just a few days and the excitement around the event is growing by the minute. As usual, there are high expectations for the conference with various sessions and talks by some of the biggest names in the industry.

Progress @ DEVintersection: Booth and Sessions

We wouldn’t miss the conference for the world and as usual the cool guys from the Product and Developer Relations teams will be present there. Head over and meet us at Booth 111, where we will have some great product demos, theater sessions and prize giveaways. We'll also be giving out our epic Telerik and Kendo UI T-shirts and a big prize: MICROSOFT XBOX ONE X.

devintersection tshirt

Sessions at Booth 111

Let me reveal a little secret about our product sessions at the booth: We're coming with the very people who personally developed the great advancements in our Telerik and Kendo UI products.

Telerik UI for Xamarin: We are excited to show you our Xamarin UI suite. It is all about beautiful, polished and elegant UI widgets for building cross-platform Xamarin applications. Telerik UI for Xamarin comes complete with predefined item templates for Visual Studio. They are included by default when you install the products. You can directly include them in your Xamarin.Forms project and use them as footprints for similar scenarios in your application.

Kendo UI: We are proud to present the most complete UI library for data-rich web applications with support for your favorite JavaScript technologies – jQuery, Angular, React and Vue. We are pleased to announce new support for React and Vue with our Kendo UI wrappers for these frameworks. You get the same great Kendo UI component features that you have come to rely on, now provided via a wrapper interface for the React and Vue frameworks. 

Telerik UI for UWP– Open Sourced! We are thrilled to provide you with UI for Universal Windows Platform - a complete UI suite for building amazing Windows 10 applications with a single code base. Completely Open Sourced!

Telerik Reporting:We are excited to present you our complete and mature reporting solution. You'll see how to build, style, view and export elegant reports seamlessly and very quickly.

Sessions and Workshops

Meet our visionaries and trend-setters @ DEVintersection:

We'll be There @ DEVintersection!

Looking for us at the conference? Just hunt down our Ninja and Kendoka and our smiling faces will greet you.

.NET DevChat: Responsive Web Apps with ASP.NET MVC and Bootstrap 4

$
0
0

In this .NET DevChat recap, we talk about building responsive web applications with UI for ASP.NET MVC and Bootstrap 4. Dive into the source code and Q&A below.

Bootstrap 4 is great, and it’s even greater when used in conjunction with Telerik UI for ASP.NET MVC.

In this .NET DevChat, we covered the basics of Bootstrap, its NavBar component, the Grid layout system as well as the new and shiny Bootstrap 4 Cards!

We dived right in and added all of these to an ASP.NET MVC application that uses Razor-based Layouts and Views.

We also covered how Telerik’s UI for ASP.NET MVC comes with an out-of-the-box Bootstrap 4-inspired theme so that all the widgets will look as any other Bootstrap styled UI element. In particular, we worked with the Telerik MVC Button, Grid, and Chart.

As promised, here’s the source code for the sample application that we developed during the live webinar.

As usual, we were thrilled to have received great feedback from you in the form of interesting questions!

Questions and Answers

What is the current status on Bootstrap 4?

As of the writing of this post, Bootstrap 4 is on its first Beta release. It had been in alpha for a few months now, but back in August Bootstrap 4 beta came out.

Can I modify the Kendo UI themes to match my company’s branding?

Yes, you can. You can use our Sass ThemeBuilder tool to generate a new theme. You can use the Bootstrap 4 theme as a base and modify from it.

If you are comfortable with Sass you can also modify scss variables to compile a new Kendo theme to use within your MVC application.

What is this Deferred functionality that was used in the demo?

This is a personal preference, and it’s not a requirement.

The reason to use the Kendo MVC Deferred initialization functionality is so that the JavaScript code to initialize the widgets can all go in the same place. Normally, you would put this at the bottom of the page.

Will this work with Telerik UI for ASP.NET Core?

Yes! Since Bootstrap 4 is just CSS, it can be used no matter the server side technology.

In the case of Telerik UI for ASP.NET Core (which supports ASP.NET Core 1 and 2), Razor is also used to generate the MVC widgets, and the actual markup rendered on to the final html page will be the same.

Hence, with the same Razor code all the UI concepts (including Deferred initialization) covered in this webinar will apply on an ASP.NET Core application

Is this type of UI also possible with Angular 4?

Certainly! We also have a webinar where we cover how to write Responsive Angular 4 Dashboards with Kendo UI for Angular.

Need a DataGrid for Your UWP App?

$
0
0

DataGrids are critical in most business apps. Why reinvent the wheel when you can use the high-performing and open source Telerik UI for UWP DataGrid instead?

Building a Windows 10 app using the Universal Windows Platform? Chances are you’ll need a DataGrid for your application, and what a better choice than the highly-performant and feature rich DataGrid from the Telerik UI for UWP suite, which is also open source and available on GitHub.

As we all know, Grids are the backbone of most line of business applications out there. They are also by far one of the hardest components to create in terms of development time, functionalities, customization, responsiveness and speed.

Developers need to be able to deliver large applications tailored to the needs of the business and following the project requirements on tight deadlines. This means quite often they must choose between building the component internally or using a third-party toolkit, which provides it out of the box.

But you already know all of this, right? So where am I going with this blog?

Well, let me cut to the chase. If you had the pleasure to attend this year’s Microsoft Build Day 2 keynote, either in person or virtually, you were probably thrilled by the announcement about XAML Standard 1.0. Abolade Gbadegesin (Architect for Project Rome) presented on the Microsoft team’s work on improving the Pen capabilities and showcased them with the Telerik UI for UWP DataGrid on stage (57:35). 

So why should you choose the Telerik UI for UWP DataGrid? Well, for starters, if you missed it, as of February 2017 the whole Telerik UI for UWP suite is open sourced. Yes, this includes the DataGrid, meaning you are more than welcome to use it in your Windows 10 application. You can get the whole product package from GitHub and start using it right away. However, there is more to a component than its free availability.

Telerik UI for UWP DataGrid—Benefits and Functionalities

Telerik UI for UWP Grid Overview

The Telerik UI for UWP DataGrid is an extremely powerful component in terms of both speed and functionality. It has been built from the ground up to deliver maximum performance and a native look and feel to your Windows 10 app. It provides advanced UI virtualization for high performance making the grid fast, fluid and responsive and capable of processing huge amounts of data blazing fast.

In addition, the DataGrid offers the ability to customize columns, through templates for the different cell types, as well to manually or automatically adjust their width depending on the content they include. This comes quite handy when one of your columns includes cells with visualizations or long strings of data. On the other hand, for columns consisting of icons, up-down arrows signifying increase/decrease, or other smaller objects, they can be scaled down to a smaller size providing better visualization of all the data in a certain row.

Another key feature that our DataGrid offers is the ability to sort single and/or multiple columns in either ascending or descending values, resulting in users being able to sort data with a single tap on the column header. These not only includes alphabetical sorting, but also numbers, values (True/False) and duration.

Sorting Telerik UI for UWP

A well known and highly used functionality of any grid is the filter. With the filtering feature in the Telerik UI for UWP DataGrid your users will be able to filter ANY type of data, be it string, decimal, Boolean or date and time. There are also various filtering functionalities to further extend the capabilities of the control. For example, you can filter by:

  • is/no equal/great/less than
  • before and after
  • Contains/StartsWith/EndsWith

The rich API behind the control allows you to easily define the advanced filtering criteria through the code and suit it to the project requirements you are working with.

Here are a few other features that the component includes:

  • Cell or Row, Single or Multiple Selection
  • Grid Filtering customization
  • Grouping—users will be able to group data by simply moving a column header to the dedicated grouping panel

Filter Telerik UI for UWP

Verdict

All and all, the Telerik UI for UWP DataGrid is a truly advanced component, which can serve you well in developing Windows 10 applications, while also cutting down your development time substantially.  The extensive documentation will decrease your learning time and will get you running in a jiff. If you are interested in learning more on add a Grid to your current application, check out this blog post on Getting Started with Telerik UI for UWP, where John Bristowe will guide you through creating an application and using the DataGrid and Chart components.

Should you require support during your development, check out our fully supported version Telerik UI for UWP and test it out in a one-month free trial.

Otherwise, get the full project and source code from our GitHub repository and you are welcome to star or fork our project. We love it when people mess with our code and find issues with it (or not ).

Happy coding!

Build Accessibility-Compliant Reports with Telerik Reporting

$
0
0

Producing accessible reports is essential for businesses that reach out to a wide audience. Telerik Reporting is ready to provide this valuable feature.

In this article, I will write about an often neglected, yet really important component of modern web applications—accessibility. When your business needs to reach a broader audience, it is vital to produce documents that are available for all users. This includes the people with motor control restrictions who experience difficulties working with a mouse or trackball, and the ones that need to use additional assistive technologies like screen readers to interpret the document content.

Fortunately, there are well-known standards and guidelines that specify how to make a document accessible. In the R3 2017 release of our product, we introduced accessibility support for our HTML5-based viewers, following the recommended practices from Section 508 of the Rehabilitation Act and Web Content Accessibility Guidelines (WCAG) 2.0. Now our users can effortlessly add accessible reports to any flavor of web applications that we support, producing content according to standards set by the WAI-ARIA specification. The process involves providing accessibility support for both report viewer and report content.

Accessible Report Viewer

The Report Viewer is the widget that allows users to preview the report and interact with the reporting engine when changing the parameters, browsing through the report pages or navigating in the document map. It now provides an option that switches its accessibility mode on or off. When the accessibility mode is enabled, the viewer activates the keyboard support, starts emitting dynamically generated descriptions for non-text items and instructs the reporting engine to render the reports according to the accessibility standards mentioned above.

Keyboard Support

Every part of the report viewer is dedicated to a different task. Based on that, it can be separated into four main areas:

  • Content—this is the main area where the currently rendered report is displayed
  • Menu—the menu bar that is used to navigate forth and back in history, go to a certain page and execute commands on the rendered report, like printing, exporting, etc.
  • Parameters—the panel where the report parameters (if any) are displayed, so the user can change them and preview the report with the new values
  • Document map—a tree view that reflects the report structure, providing a set of navigational links to the report items in the rendered report

In accessibility mode the viewer labels the areas as landmarks and allows using shortcut keys to directly focus on them and navigate within their content—menu buttons, parameter editors and document map nodes. When a report is rendered in accessibility mode, its content is marked as focusable and can be traversed with the keyboard. The keyboard can also be used to execute an interactive action if the focused report item has one set.

Dynamically Generated Descriptions

When the accessiblity mode is enabled, the focusable elements in the viewer areas provide labels that can be read by an assistive technology like a screen reader.

The menu area sets labels on its buttons and submenus, explaining the function they execute and their current state (enabled or disabled). The parameter area provides information about the parameters it contains, as does each parameter editor about its type, currently selected value and (if needed) a validation message. The document map area generates labels for its nodes so the screen reader can inform the user which navigational link currently has focus.

Accessible Report Content

When designing a report using Visual Studio or Standalone Report Designer, the user can provide additional information about every report item, setting an expression for its AccessibleDescription property. The evaluated expression will produce a WAI-ARIA compliant attributes, but it will be respected only when the report viewer has its accessibility mode enabled, so no redundant markup will be generated. This property is extremely useful when the report contains a non-textual item like a PictureBox or Graph, and helps provide valuable information to the user about the currently focused element.

By default, if the AccessibleDescription value is not set, the report item will produce an accessible label, based on its Value property, which would cover the most scenarios and no report refactoring will be needed. Additionally, the engine concatenates some meta information, related to the current report item, so the user will be given as much detail as possible. 

For example, if the report contains a table, its accessible label will automatically be appended with information about the rows and columns count. Each of the table cells will emit information about its position in the table—whether it is a header cell, and on which row and column it is placed. So if a report contains a TextBox with Value = "Sorts by Category," that performs a sorting action and is nested in a table's first (header) row and third column, the generated label value will be: Text box. Performs a sorting action. Column header. Column two, row zero. Sorts by Category.

Customization

The HTML5-based report viewers accessibility mode is disabled by default, so no excessive HTML markup will be generated. It can be set through the report viewer’s initialization script, using the enableAccessibility(true) option. When adding a report viewer to a project with the Item Template Wizard, its last page suggests setting the accessibility mode and generates the required option automatically. The texts, generated by the accessibility module, can be localized easily, and the default shortcut key mapping can be changed if it interferes with the default browser behavior.

Want to Learn More?

Having a report tool that produces content to meet accessibility standards can be a great benefit when striving to provide the best solution for the most people. The Telerik Reporting team at Progress will continue our efforts to introduce the accessibility support for the entirety of technologies covered by our report viewers. If you would like to learn more about the process, take a look at the new features, check the product roadmap or try it yourself for free!

Get Reporting in our Bundles

You can get Telerik Reporting as an individual product or as a part of our bundles. We bring the best of Telerik and Kendo UI together in convenient bundles, including a wide-range of UI, reporting and productivity tools for both .NET and JavaScript technologies and support that’s got your back in every step of your project. Thanks to our intuitive APIs, alongside thousands of demos with source code availability, comprehensive documentation and a full assortment of VS templates you will get up and running with our tools in no time and fully embrace your inner warrior (Kendoka/Ninja).

By leveraging the broad array of themes, skins, styling and customization options, your application will awe even the best front-end designers. Check it out!


4 Ways to Export from WPF and WinForms to Word and PDF Files

$
0
0

Looking to add functionality in your .NET apps to export data to Word and PDF? Learn four ways to do this with just a little code.

Building feature rich applications can often leave users asking to take visual elements off the screen to be used elsewhere. Being able to export from an application to Word or PDF opens up new possibilities, such as sharing, reporting or even satisfying Sarbanes–Oxley (SOX) audit requirements.

Getting data out of your application and into standard formats like Microsoft Word and Adobe PDF can be a daunting task. Especially when performance optimizations for large datasets, document customization & appearance, and supported platforms are taken into consideration.

However, with the right tools, adding this feature to your .NET application can be as simple as a few lines of code. Let's take a look at 4 ways we can include rich document functionality in our .NET apps with very little code and time investment.

For the examples we'll be using the Telerik Document Processing Library (DPL), which is distributed at no additional cost with the Progress Telerik UI libraries for WPF, Silverlight and WinForms. For the web developers out there, the DPL is also included with ASP.NET Web Forms and MVC. In addition, no MS Office licenses or dependencies are required to use the DPL.

If you’re using Telerik UI, you already have these capabilities in your toolbox and we’ll learn how to leverage them. If you’re not using Telerik UI yet, but would like to increase your developer productivity, learn more about it here.

1. Create New Word Document in .NET

Having the ability to create a new Word document from code provides a great deal of flexibility. With a just few dependencies we have access to Word document creation APIs that include text, image, and link generation. For this example, we'll use RadFlowDocument and RadFlowDocumentEditor to create a new Word document from a .NET console application.

We'll start with a few dependencies like System.IO to handle a file stream, and the necessary Telerik DPL assemblies.

usingSystem.IO;
usingTelerik.Windows.Documents.Flow.FormatProviders.Docx;
usingTelerik.Windows.Documents.Flow.Model;
usingTelerik.Windows.Documents.Flow.Model.Editing;

Next, we create a new RadFlowDocument and RadFlowDocumentEditor. The RadFlowDocumentEditor will allow us to insert new text, image and other elements to the document.

staticvoidMain(string[] args)
 
{
 
    RadFlowDocument document = newRadFlowDocument();
 
    RadFlowDocumentEditor editor = newRadFlowDocumentEditor(document);

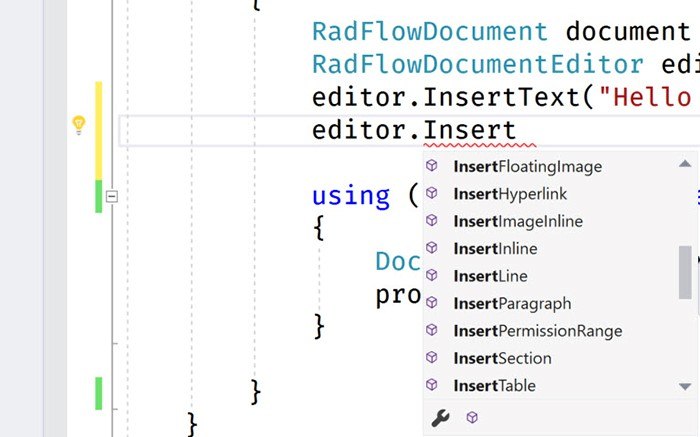
Using the editor, we'll write some text to the document using the InsertText method. We also have additional methods available such as:

  • InsertFloatingImage
  • InsertParagraph
  • InsertTable
  • InsertHyperlink
  • and more
insert-methods
staticvoidMain(string[] args)
 
 
{
 
 
    RadFlowDocument document = newRadFlowDocument();
 
 
    RadFlowDocumentEditor editor = newRadFlowDocumentEditor(document);
 
 
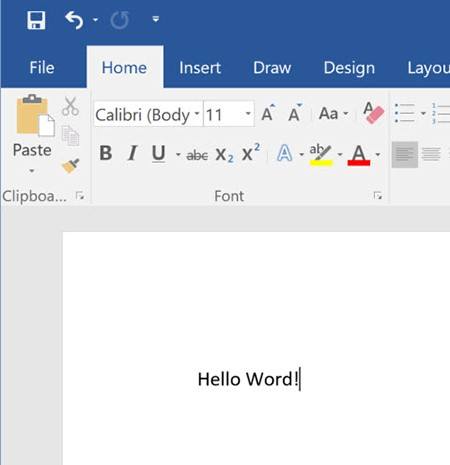
    editor.InsertText("Hello Word!");

Once the document is complete, we just need to write it to the FileStream. For the RadFlowDocument we'll use the DocxFormatProvider to export to the DOCX format. Similarly, we could use a PdfFormatProvider to create a PDF document.

usingSystem.IO;
 
 
usingTelerik.Windows.Documents.Flow.FormatProviders.Docx;
 
 
usingTelerik.Windows.Documents.Flow.Model;
 
 
usingTelerik.Windows.Documents.Flow.Model.Editing;


namespaceDocProcessing
 
 
{
 
 
    classProgram
 
 
    {
 
 
        staticvoidMain(string[] args)
 
 
        {
 
 
            RadFlowDocument document = newRadFlowDocument();
 
 
            RadFlowDocumentEditor editor = newRadFlowDocumentEditor(document);
 
 
            editor.InsertText("Hello Word!");


            using(Stream output = newFileStream("output.docx", FileMode.OpenOrCreate))
 
 
            {
 
 
                DocxFormatProvider provider = newDocxFormatProvider();
 
 
                provider.Export(document, output);
 
 
            }


        }
 
 
    }
 
 
}

HelloWorld

In this example, files created using the Telerik DPL are saved directly to disk. However, any file created using the DPL can also be downloaded via the browser from UI for ASP.NET AJAX and UI for ASP.NET MVC applications.

2. Mail Merge from .NET

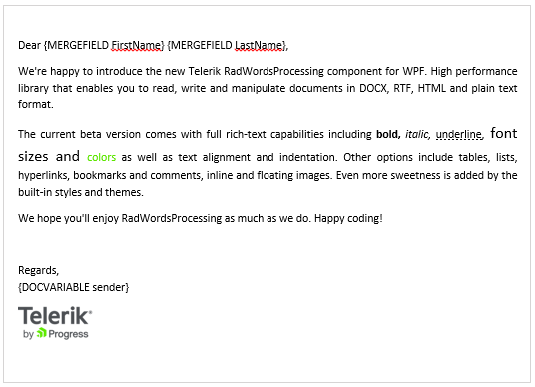
Creating a mail merge is an effective way of building a template and populating it with data for processing documents in batches. With the mail merge process, you can create a series of personalized documents based on your data source.

The mail merge process is one that is often manually performed inside of Microsoft Word. With the Telerik DPL this process can be completely automated and customized based on the needs of your application. The mail merge APIs can be used virtually anywhere in .NET. To see it in action we'll use an example of how a mail merge is executed in a WPF/WinForms application.

We'll create a new document containing our template message. To create a template field in the document we'll use the InsertField method and set the field code to MERGEFIELD with the variable name we wish to use, in this case FirstName. The variable name simply matches the property on an object that we'll supply to the MailMerge method.

privateRadFlowDocument CreateDocument()
 
 
{
 
 
    RadFlowDocument document = newRadFlowDocument();
 
 
    RadFlowDocumentEditor editor = newRadFlowDocumentEditor(document);


    editor.InsertText("Dear ");
 
 
    editor.InsertField("MERGEFIELD FirstName", "");
 
 
    editor.InsertText(" ");
 
 
    editor.InsertField("MERGEFIELD LastName", "");
 
 
    editor.InsertLine(",");
 
 
    editor.InsertLine("This is a sample Mail Merge");
 
 
    returndocument;
 
 
}

With the document created, the next step will be to perform the mail merge. The MailMerge method takes any IEnumerable as a parameter, in this case we'll use a predefined list of Person via GetRecipents. In this case Person has a FirstName and LastName property matching the MERGEFIELD variables.

protectedvoidbutton_Click(objectsender, EventArgs e)
 
 
{
 
 
    RadFlowDocument document = this.CreateDocument();
 
 
    RadFlowDocument mailMergeDocument = document.MailMerge(GetRecipients());
 
 
    //save the document
 
 
}

The document can be saved by setting up a MemoryStream and calling Export from a DocxFromatProvider. Once the memory stream is ready, we'll write it to a file.

protectedvoidbutton_Click(objectsender, EventArgs e)
 
 
{
 
 
    RadFlowDocument document = this.CreateDocument();
 
 
    RadFlowDocument mailMergeDocument = document.MailMerge(GetRecipients());
 
 
    byte[] renderedBytes = null;


     using(Stream output = newFileStream("output.docx", FileMode.OpenOrCreate))
 
 
     {
 
 
         DocxFormatProvider provider = newDocxFormatProvider();
 
 
         provider.Export(mailMergeDocument, output);
 
 
     }}

The result is a multi-page .DOCX file for each recipient provided to the mail merge. This type of document can easily be printed and sent to clients as physical mail. See demos.telerik.com/wpf and the UI for WinForms demos for a more comprehensive example that includes additional file types and document features.

mailMerge

3. Convert Word to PDF in .NET

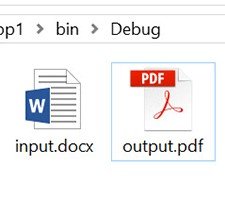
One of the Telerik DPL strengths is its ability to import and export various file types like: DOCX, PDF (export only), HTML and RTF. Because of this ability, it can also be used to do file conversions between these types as well. Using the IFormatProvider we can utilize the various format providers within the Telerik DPL interchangeably. Let's take a look at a basic example of a console app that can import a DOCX file and export it to PDF.

We'll begin by creating a default provider using an IFormatProvider and setting it to an instance of DocxFormatProvider. A RadFlowDocument is used as our document in the conversion from DOCX to PDF.

IFormatProvider<RadFlowDocument> fileFormatProvider = newDocxFormatProvider();
 
 
RadFlowDocument documentToConvert = newRadFlowDocument();

The DOCX document is opened from disk using the DocxFormatProvider and streamed into memory.

using(FileStream input = newFileStream("input.docx", FileMode.Open))
 
{
 
documentToConvert = fileFormatProvider.Import(input);
 
}

With the document in memory as a RadFlowDocument we can change our provider from a DocxFormatProviderPdfFormatProvider. Now the document can be written back to disk as a PDF.

fileFormatProvider = newPdfFormatProvider();


    using(Stream output = newFileStream("output.pdf", FileMode.OpenOrCreate))
 
    {
 
        fileFormatProvider.Export(documentToConvert, output);
 
    }

Convert Doc PDF

As you can see in the complete example, in just a few short lines of code we're able to convert from DOCX to PDF.

staticvoidMain(string[] args)
 
{
 
    IFormatProvider<RadFlowDocument> fileFormatProvider = newDocxFormatProvider();
 
    RadFlowDocument documentToConvert = newRadFlowDocument();


    // Read DOCX
 
    using(FileStream input = newFileStream("input.docx", FileMode.Open))
 
    {
 
        documentToConvert = fileFormatProvider.Import(input);
 
    }


    // Write PDF
 
    fileFormatProvider = newPdfFormatProvider(); // change format provider to PDF


    using(Stream output = newFileStream("output.pdf", FileMode.OpenOrCreate))
 
    {
 
        fileFormatProvider.Export(documentToConvert, output);
 
    }
 
}

This method of importing and exporting documents can be used to convert between file formats. One caveat however is that there is no import functionality for PDF documents due to file format limitations. To deal with this limitation the IFormatProvider is equipped with a CanImport property that can be checked before the Import operation is performed.

See the UI for WPF and UI for WinForms WordsProcessing demos that includes additional file types and scenarios.

4. Edit Microsoft Word Docs in WPF and WinForms

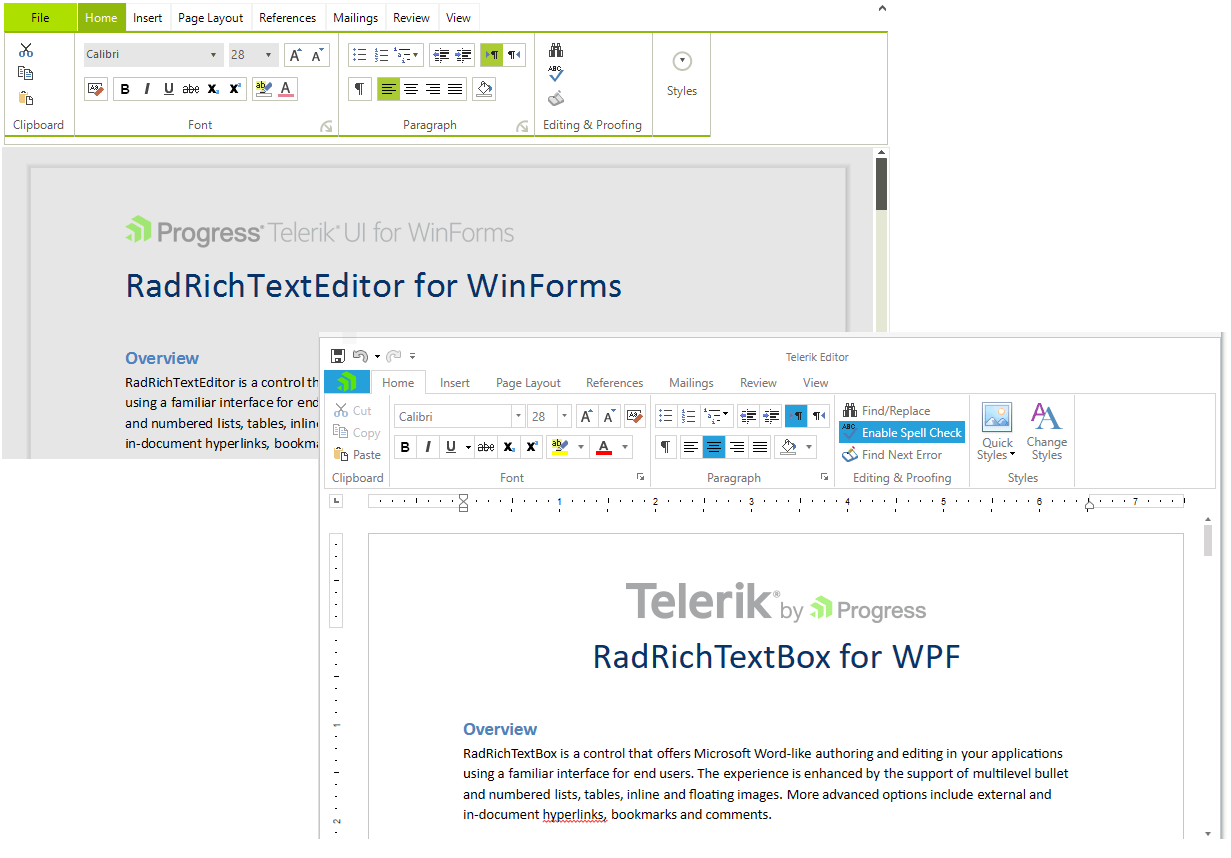
Customers can sometimes ask for time-consuming project requirements, like the ability to edit Word Documents in the application without the need to leave the app and use external editors. On the surface this sounds like a feature that will take quite a bit of effort to accomplish; however, it's as simple as adding a rich text component to your application which comes with the Telerik UI for WPF and Telerik UI for WinForms suites.

rtb combined

Using UI for WPF and UI for WinForms, the ability to import and export right from the rich text editor control can be accomplished with few lines of code.

DocxFormatProvider provider = newDocxFormatProvider();


using(FileStream fileStream = newFileStream(@"input.docx", FileMode.Open))
 
{
 
    this.radRichTextBox1.Document = provider.Import(fileStream);
 
})

Exporting the content is just as simple. Simply pick the format provider for the desired format – PDF, DOCX, XAML, HTML, RTF, TXT and utilize its Export() method.

DocxFormatProvider provider = newDocxFormatProvider();
 
SaveFileDialog saveDialog = newSaveFileDialog() { DefaultExt = ".docx", Filter = "Documents|*.docx"};
 
DialogResult dialogResult = saveDialog.ShowDialog();
 
if(dialogResult == System.Windows.Forms.DialogResult.OK)
 
{
 
     using(Stream output = saveDialog.OpenFile())
 
     {
 
         provider.Export(radRichTextEditor1.Document, output);
 
     }
 
}

See the Telerik UI for WPF and Telerik UI for WinForms demos for more comprehensive examples that include additional editor features.

Conclusion

Whether you need to create documents from scratch or edit in the desktop app, the Telerik UI libraries make short work of any document export task for .NET developers. With the Telerik Document Processing Library new files can be created from scratch as DOCX, PDF, RTF, or TXT. Advanced features such as mail merge can reduce manual tasks with app driven automation. With the addition of Telerik UI libraries powered by UI for WPF and WinForms, documents can be edited on screen and custom export features empower users to export content with the click of a button.

Get access to the vast benefits of Telerik Document Processing and document exporting by downloading either the full Progress DevCraft bundle or any technology-specific library you need: Telerik UI for WPF or Telerik UI for WinForms.

Other Useful Resources

Telerik UI R3 2017 Release Webinar Wrap-Up

$
0
0

Join us for a recap of the latest release of our Telerik UI tools, updated and upgraded to help you develop better apps faster.

Earlier this week, Ed Charbeneau, Sam Basu, and I hosted the R3 2017 release webinar for our Telerik UI tools. We featured everything new in our latest release for Telerik UI for ASP.NET MVC, Telerik UI for Xamarin, Telerik UI for WPF, and many more. This blog post provides an overview of the webinar, a recording (in case you missed it), and a summary of the questions (with answers) that were posed during the webinar through #HeyTelerik on Twitter.

Webinar Recording

Don’t worry if you didn’t get a chance to watch the webinar. We’ve posted it to YouTube. You can watch it now.

Webinar Prize Winners

What would be a webinar without some cool prizes? Here are the winners of this webinar for asking great questions:

  • Koti Vuppalapati
  • Igor Soyfer
  • Shawn Hosp
  • Jennifer Bartolome
  • Peter Geiter

Congratulations! You’ve won a Holy Stone F181 RC Quadcopter Drone!

Questions and Answers

We received a wide range of questions during the webinar. Here’s a few of them that we had an opportunity to answer.

Kendo UI for jQuery

Are there plans to include the Material Theme in the jQuery version of Kendo UI?
A Material theme is available Kendo UI for jQuery, Kendo UI for Angular, Telerik UI for ASP.NET MVC, and Telerik UI for ASP.NET Core. This theme is a SCSS-based theme for the Kendo UI components which is based on the Material design guidelines.

What is the best way to get trained on Kendo UI and others and leverage the great potential of the product?
We offer training, here’s where you can read more: Kendo UI Training.

Telerik UI for ASP.NET MVC

When will this release appear on your private NuGet server?
Our release is available now.

Why RadVirtualGrid doesn’t include built-in filter/sorting like RadGridView?
I would take a look at our virtualization demo with the RadGrid. If that won’t help you achieve what your looking for, please let us know: Feedback & Feature Requests.

Does the new infinite scrolling grid load data periodically similar to the “News Feed” on most social media platforms?
Yes, that’s the idea!

Are these grids updates available only on Kendo UI, or are comparable updates available in the Grid for ASP.NET AJAX for .NET?
They should be pretty close to feature-parity. Since the RadGrid is older, it often has existing features that are “new” to the Grid widget in Kendo UI for jQuery. That stated, we improved accessbility with the RadGrid in the R3 2017 release; we now offer WAI-ARIA support validated by WAVE.

Looking at the new grid, I notice that when clicking delete we still get a standard confirm alert. Will it ever be possible to plug in our own confirm box?
You should be able to use PreventDefault and implement your own dialog. There’s an example in our docs: Customize Confirmation Window.

When using Virtual Scrolling at what point is the Read action executed? Only at the beginning? Or, at page breaks? How much and when is the data sent from the controller to browser?
When the page loads, Read() is called. Upon reaching the end of the page, Read() is called. The page length can be adjusted via property.

For operations with the Grid, what client-side security is possible to prevent attacks?
First, never trust the client. And second, always validate on the server before committing any operations against data. The good news is that you can perform this validation quite easily with Telerik UI for ASP.NET MVC since you can control the what happens on the server side.

Is it easier for searching data with the Grid instead of having to tweak the control in order to perform a search after pressing the enter key?
We have several ways to filter the grid. One type allows the enter key to submit the filter. Filtering is one of the Grid’s best features. We’ve made it highly-customizable so you can build the kind of user experience you need.

Can a grid cell be edited like a Spreadsheet? For example, to automatically move the cursor to the next cell when enter key is pressed.
We have many inline and batch editing capabilities. We also added new keyboard shortcuts to Kendo UI for jQuery and Telerik UI for ASP.NET MVC for this latest release.

Can you add Drag & Drop controls to Telerik UI for ASP.NET MVC?
We have Drag & Drop functionality built into many of our controls. It’s supported through Kendo UI, which is the client-side library used by Telerik UI for ASP.NET MVC. Further details about the Keyboard, Section 508 and WAI-ARIA support of Telerik UI for ASP.NET MVC extensions can be found in the Accessibility Overview section of the documentation.

Does the Scheduler support CRON inputs?
No. The recurrence rule string for events in the Scheduler follows the RRULE format as outlined in the iCalendar specification (RFC 5545). You’d need a cron parser and converter in order to get this working with the Scheduler.

With Virtual Scrolling and Endless Scrolling, how does the Excel export work?
Great question. Virtual scrolling and endless scrolling operate in similar ways in that they load data on-demand. This means that the Grid will typically have only a subset of the entire underlying data source loaded in its view. When the user exports this data to Excel, only the data contained in the current view will be exported.

Telerik UI for Xamarin

For the busy indicator, what is the default timeout? If we have more data, will it spin until it’s done loading?
The Busy Indicator has a simple IsBusy property that you can turn it on/off programmatically as needed.

Is there anything planned like the Scheduler or the Gantt chart for Telerik UI for Xamarin?
We are talking about it. Please drop us a line: Feedback & Feature Requests. We’ll update the roadmap for Telerik UI for Xamarin very soon.

What packages and/or products do I need from Telerik to use the Xamarin tools?
I’d start with Telerik UI for Xamarin and learning resources from Microsoft such as Xamarin University.

Are you going to support bottom navigation (tabs) for Xamarin Android?
The RadTabView allows developers to create user interfaces similar to the Android tab view (view pager and app bar combo) that can be positioned on all four sides of the parent view (typically of the main view).

If using Xamarin forms, do Windows apps compile to UWP to work on xbox, desktop, and mobile?
Yes. Xamarin.Forms has full UWP support and Telerik UI for Xamarin can light up your apps everywhere.

Is there performance hit using paths in Xamarin vs doing the drawing natively?
It’s minimal. We’re using Skia. Drawing native isn’t for the faint-hearted.

Why is Grid showing as a CTP?
We have many grids, each written ground-up. The one in Telerik UI for Xamarin is new and customized for cross-platform mobile. Hence, the CTP. It should be final soon.

When do you expect the DataGrid in Telerik UI for Xamarin to be fully-released?
Soon. We’ll likely do a couple of updates before final release. ETA R1 2018.

Telerik UI for UWP

How does UWP OSS work? Surely if all source is available then developers could do anything without a proper license?
It is completely free & OSS under MIT licensing. We do offer support. Sharing the love :)

With the recent news about Windows Mobile, is it worth writing UWP apps that target mobile?
I would suggest using Xamarin and Telerik UI for Xamarin if you’re looking to build mobile applications. That stated, UWP and Telerik UI for UWP helps you to build applications that run on all types of Windows-based devices. This includes the Xbox, HoloLens, IoT, and more.

Do you have anything with ink on Windows 10?
We had a demo with our UWP grid at Microsoft Build earlier this year showing how to use ink. Here is the moment from the keynote address where the Grid control was demonstrated with ink support:

Is there something for holographic apps? I know, it’s basicly like a UWP or Xamarin app, but maybe you got something more.
Telerik UI for UWP is open source and works in applications built for HoloLens.

Telerik UI for WPF

When should I use GridView vs (new) VirtualGrid for WPF? Is the GridView going to be replaced in the future with the VirtualGrid?
These controls are similar but they serve two very different purposes. The GridView displays data in a tabular format and supports many operations against this data. It’s ideal for displaying small-to-large sets of data. The VirtualGrid—on the other hand—is best suited for displaying massive data sets with a minimal in-memory footprint. The GridView is here to stay. It’s packed with features and is one of our most popular controls.

Telerik Reporting

We use Telerik Reporting in a WebForms application. Our large reports that have included controls (icons) fail to render. Is there a solution?
This sounds like you have a broken resource somewhere in your application. I’d recommend firing up your browser’s developer tools or Telerik Fiddler. Look for HTTP 404s (File Not Found) occurring for requests in stylesheets or for images. If any 404s are present then you need to resolve them.

What improvements have you made to the Standalone Report Designer in R3?
You’ll find a summary of the improvements we’ve made in the R3 2017 release: Telerik Reporting – Release History.

Did you think about a R interface or integration for your charts?
Nice suggestion! Please drop us a line and let us know what you’d like to see: Feedback & Feature Requests.

RowDetails Support in the UI for UWP R3 2017 Release

$
0
0

Our latest official release features RowDetails support for RadDataGrid, major bug fixes and more.

In our official R2 SP1 release, we introduced some performance improvements for our Chart and ListView controls. With the R3 release we focused on another major control in the UI for UWP suite – the DataGrid control. 

Let me provide you with some more information about the new RowDetails feature we introduced for the DataGrid control and the Toolbox improvements we have made for our open-source repository NuGet package. 

RadDataGrid RowDetails

We are extending the DataGrid functionalities with the RowDetails feature, which will allow the application’s users to view the record-related data inline, without the need to switch context. Being able to show details for the DataGrid row is extremely useful, and with our latest improvements it's both easy and highly customizable.
DataGrid-RowDetails

Nuget Toolbox Support

With Visual Studio 2017 Toolbox support has been added for the NuGet packages to easily view and categorize the controls. We have taken advantage of this feature and updated our NuGet package to support it. As soon as the NuGet package is referenced, the controls it contains will appear in the Toolbox for you to use in your application. These controls can be used just like any other Toolbox control, with drag and drop support on the design surface.

NuGet_Toolbox

Chart Improvements

There are a bunch of improvements coming to the Chart control, starting with utilizing the composition API that the framework offers to boost the rendering performance of the Chart control.

Old Rendering Performance

oldchart

New Rendering Perfromance

newchart

Share Your Feedback

Take a look at the open source UI for UWP project when you have a chance. There you can share your feedback or add your own contributions. We highly appreciate any contributions that are helpful for improving the controls.

For a full list of what is new and what is improved in the Telerik products, make sure to subscribe for the R3 2017 release webinar

Introducing New Support Options & Product Bundles

$
0
0

Whether you use Kendo UI, a DevCraft bundle or other Telerik products, and no matter the support you need, we have great new options for you.

Some months ago, we set out on a journey to review our bundles and the way in which our products are offered. Through this process, we have spoken with and read feedback from so many of our customers. The applications you are building with our products spread the gamut from custom and niche to mission-critical enterprise; from line-of-business to consumer facing. Our developer community is helping to make the world better through technology and innovation – and we are inspired.

Through these conversations, we developed a rich understanding of the frameworks you are using today, and the technologies you may use in the future. Beyond products and technology, we discussed what you expect from our technical support – and of course we discussed the overall value you place on our products and service.

Thank you for the overwhelming response we received to our reach-out – the changes described below are a direct result of the process so many of you were involved in.

Changes to Technical Support

Most of our individual products can now be configured with one of three options for technical support – this gives you the ability to choose the appropriate level of support for you and your team. If you ever need a higher level of support, your subscription can always be upgraded.

  • Lite - 72-hour response time (10 ticket limit) – This option allows you to purchase our products at an incredible value and provides just enough support for small projects that are not on tight timelines.
  • Priority - 24-hour response time (unlimited tickets) – Perfect for professional developers with typical deadlines.
  • Ultimate – Ideal for professional developers with tight deadlines. Phone support can provide immediate or same-day solutions to commonly encountered issues, remote web assistance can be used to observe issues in your own environment, and issue escalation allows the most critical issues to be escalated directly to product developers.

For more information and a complete side-by-side comparison of the support plans, click here.

DevCraft Bundles

Our DevCraft bundles offer .NET developers the most cost effective way to futureproof their toolbox, and streamline beautiful UI across a variety of technologies and frameworks. Effective today, we are introducing a new ‘DevCraft UI’ bundle that includes all the Telerik UI products that a .NET developer could ever need at an incredible price of $1299. DevCraft UI joins DevCraft Complete and DevCraft Ultimate, which have also been updated. To learn more about our new line-up of DevCraft bundles, click here.

Changes to Kendo UI

We believe that the biggest changes for our Kendo UI product is the introduction of React and Vue support. React and Vue support join existing support for jQuery and Angular, creating the industry’s most complete UI toolbox for JavaScript developers. You may also notice that we have simplified the product names into a single offer called Kendo UI that comes complete with jQuery, AngularJS, Angular, React, and Vue support. Additional server-side wrappers for ASP.NET MVC, ASP.NET Core, PHP, and JSP can be added as needed, and like our other UI products, Kendo UI can be configured with Lite, Priority, or Ultimate support. To learn more about pricing and what is included in Kendo UI, click here.

I own a license of Telerik, DevCraft, or Kendo UI – what does this mean for me?

While full details can be found here , we are pleased to inform you that you will have access to all the great products and support you initially purchased – and in some cases even more. Additionally, you will maintain the same level of support and the same renewal prices.

Thanks again to our amazing community of developers – we love you and hope you love the new R3 bits and bundles.

.NET Ninja Tooling Arrives—Shipping the Telerik R3 Release

$
0
0

It's here—the Telerik R3 2017 release has landed, packed with new features and updates for your favorite UI tools and components. Read on to see what's new.

We are closing off our last release of the year with a big bang. To make you more productive, we are shipping 10 new controls across all UI frameworks. We've enhanced Document Processing Library with advanced PDF manipulation options, introducing new themes and various analytics integration capabilities. In addition, we've expanded our existing components with more features and customization options. Most of all, we are further enhancing product support to allow for your specific needs.

You are probably interested in seeing all the features we are shipping for each individual platform. Dig into the specific team blogs and product pages to learn more:

  • Full support of ASP.NET Core 2.0
  • Theming support in Xamarin, in addition to a brand-new Grid CTP component
  • New RadVirtualGrid and interactive forms for WPF
  • New Spreadsheet component from our WinForms
  • RowDetails support in RadDataGrid on UWP
  • Reporting gets boosted performance & accessibility (WCAG 2.0 support)
  • And our brethren Kendo UI gets support for React and Vue

If all you want is the hardcore product facts, you can stop reading right here. But there is more!

We are investing heavily across the board and we believe it shows—just glance at our what’s new page or download the latest bits. We are also “shipping” a new look for the .NET Ninja mascot! A substantial product release like R3 2017 and the ongoing investment had to be paired with a new look. The new .NET Ninja exemplifies the ongoing commitment we have for all our fellow .NET developers. The .NET Ninja is also in better shape than ever and ready for action. This is what you can expect from us: the modern UI, fast releases, awesome support, productivity and ease of use you’re already used to—just better. Hold me accountable to it!

En route to making you a better .NET Ninja, we are also making all the UI tooling available to you via a single UI bundle, called DevCraft UI for just $1299.  It now includes our UI for Xamarin controls, which was previously available only in DevCraft Ultimate. Now you have all the tools at your disposal when developing striking apps for Web, Desktop or Mobile. Moreover, you now have multiple technical support options (Lite, Priority, and Ultimate) to suit your specific needs.

And what would a product release be without a flashy webinar—right? Here are two webinars to check out:

  • Telerik: October 11th. Register here.
  • Kendo UI: September 28th. Register here.
  • Don’t have time to attend—why not take the tools for a spin now then at the link below?
Start a Free Trial Now

What's New in Telerik Reporting and Telerik Report Server R3 2017

$
0
0

New Financial Charts, web viewer accessibility, better performance for Excel rendering, memory optimizations for PDF rendering and bug fixes make the new R3 2017 release irresistible.

The R3 release of Telerik Reporting is now live and we are ready to brag about all of the goodness we have to share with you.

Web Report Preview Accessibility

All of the HTML5-based report viewers (jQuery, MVC, Angular 2+ and Web Forms Report Viewer), now support major accessibility features like comprehensive keyboard navigation in both the viewer and its content, and dynamically extended markup that provides support for most of the popular screen readers.

Our goal is to provide a reporting solution that is accessible to a wider audience, including users with motor control restrictions who may need to work with assistive technologies. We follow the recommended practices in Section 508 of the Rehabilitation Act and the Web Content Accessibility Guidelines (WCAG) 2.0 Level AA to the greatest extent possible.

OHLC Chart

The OHLC chart displays a series of candlestick or bar markers that represent information about price movement. The marker can be colored depending on the movement of the price for this period—if the close level is lower than the open level, it's recognized as a bearish pattern and the color or the fill or the marker changes so it can be distinguished from the bullish pattern, where the close level is higher than the open level.

More Performance Improvements

In this release we have significantly improved Excel rendering by introducing a better algorithm for the Excel grid generation. This improvement can decrease the rendering time multiple times over, depending on the report. The bigger the report is, the bigger the improvement.

In the case of the popular PDF format, we have focused mainly on memory optimizations. The report engine now handles PDF pages continuously, enabling us to release .NET objects that keep page structure immediately after the page is rendered. This optimization reduces the memory allocation when rendering big PDF reports.

Crosstab is an essential report item and in this release, we have improved the crosstab generation algorithm. Now even big crosstabs will be prepared in a reasonable amount of time.

Data Schema from the Report Server

The Standalone Report Designer doesn't need direct connection to the SQL data source. Instead the designer requests the database schema, data models and preview data from the Report Server. This way the report author doesn't have to install ADO.NET data providers, or to request DB permissions. The connection string is kept on the server and will not be exposed to report authors without data source creation rights.

Eliminated Bugs

For the full list of all the bug fixes, check the release notes for Telerik Reporting and Telerik Report Server.

Try it Out and Share Feedback

We want to know what you think—you can download a free trial today and share your thoughts in our Feedback Portal, or right in the comments below.

Build Once Deploy Everywhere with Telerik Reporting

$
0
0

Reporting solutions can supply powerful functionality for your reports. Here's a tip on how to use one to create a report once and present it anywhere.

In this blog post, I'd like to talk about one of the key benefits of using a reporting solution for reports. This is the flexibility of authoring reports just once, and then presenting them in a variety of application frameworks and document formats.

In the core of our report engine is the declarative definition paradigm. Most programming languages define what something is and how to do something. The report definition describes what the output will look like and where the source data is coming from. This leaves the application free to decide how to generate the defined look and feel, regardless of the programming language or underlying architecture. The benefit is easy coding free option to create impressive reports with a data-driven report layout.

In order for the declarative model to work, a mature designer is needed. We do have not one, but two options:

  • Standalone Report Designer for a code free report authoring experience, so even professionals with basic data operations knowledge can design reports.
  • Visual Studio integrated Report Designer for all .NET ninjas.

Once the report definitions are ready, the reporting engine combines it with the provided data and cuts the generated items into pages, which then outputs it in the target document format. This can be any of the popular document formats: PDF, HTML, Excel, Word, RTF, XPS, PowerPoint, TTF, CSV, EMF and various image formats.

The rendered document is presented in a document viewer or in one of the available dedicated report viewer widgets. Telerik Reporting provides a variety of report viewers for popular application frameworks like HTML5, Angular, MVC, WPF, WinForms, Web Forms and even for good old Silverlight. The benefit of using a native report viewer is to embed reports in the application and take advantage of awesome interactivity features like filtering with parameters, data drill-down, sorting, navigation within the report or to other reports or external URLs. All of this awesomeness comes out of the box and only needs a simple setup while authoring the report definition.

Based on the application technology used, we have different options for hosting the reporting engine. The engine is built with the .NET framework, so in case of the web technologies and non-.NET application frameworks, it's hosted on a service or directly used through the Telerik Report Server. The following options are available:

  • WCF Service for the Silverlight Report Viewer;
  • REST Service for all web and desktop viewers;
  • Telerik Report Server for all web and desktop viewers;
  • The embedded reporting engine in the .NET desktop viewers.

This concludes our short journey into the wonders of reporting solutions. Reporting solutions provide quick ways to make data visualizations from various data sources for previewing, printing, sharing and archiving. They can be a powerful ally when reports are needed.

Telerik Reporting

Telerik Reporting is an embedded reporting solution that can be easily embedded in your application. For more information see http://www.telerik.com/reporting.

Telerik Report Server

Managing a vast collection of reports may be challenging and therefore we have introduced the Telerik Report Server solution to efficiently store, create and analyse reports in a single server-side repository. Telerik Report Server leverages the feature-rich Telerik Reporting engine and supports all must-have report server features like scheduling, data alerts, versioning, report caching, authentication with AD FS support, ready to use report server web portal with enabled white labeling and complete REST API for integration with your desktop and web applications. For more information on the report server solution see: http://www.telerik.com/report-server

Get Reporting in our Bundles

You can get Telerik Reporting as an individual product or as a part of our bundles. We bring thebest of Telerik and Kendo UI together in convenient bundles, including a wide-range of UI, reporting and productivity tools for both .NET and JavaScript technologies and support that’s got your back in every step of your project. Thanks to our intuitive APIs, alongside thousands of demos with source code availability, comprehensive documentation and a full assortment of VS templates you will get up and running with our tools in no time and fully embrace your inner warrior (Kendoka/Ninja).

By leveraging the broad array of themes, skins, styling and customization options, your application will awe even the best front end designers. Check it out!

Get Started Today

Are you ready to dive deep into the world of reporting? Start a free trial of Reporting and Report Server today and don’t forget that the free trial comes with free support.


How to Use ASP.NET Core TagHelpers

$
0
0

ASP.NET Core has gained a helpful new feature in TagHelpers. Stay up to date with the latest info and learn how you can use them in your apps.

Recently Microsoft announced the release of ASP.NET Core 2.0. With this release comes a new feature for building HTML views called TagHelpers. With ASP.NET Core 2.0 TagHelpers allow developers to write component based views for server side rendering by utilizing a syntax similar to HTML. This new syntax incorporates concepts used in HTML, elements and attributes.

When using TagHelpers in a .cshtml view, Visual Studio treats the TagHelper as it would HTML but with added server side functionality. Often with HTML Helpers the CSS class attribute was difficult to add, and completely lacked Intellisense. With TagHelpers, developers get rich Intellisense for not only server side code but also with any HTML attributes supported by Visual Studio.

In addition to better Intellisense, TagHelpers also make great container elements. TagHelpers treat their inner HTML content as normal HTML elements do. In comparison to HTML Helpers, nested content required escape codes, or specialized using blocks to contain inner HTML content.

Throughout .NET’s journey from conceptualizing ASP.NET Core TagHelpers to our recent release, Progress has continued to support the community by sharing information about TagHelpers. Below are resources that will help keep you up to speed on the latest developments with ASP.NET Core TagHelpers.

Building Reuseable Components in ASP.NET Core

Telerik UI for ASP.NET Core supports a variety of TagHelpers with more on their way. Try our TagHelpers with a thirty-day free trial of UI for ASP.NET Core.

Progress @ DEVintersection: Sessions, Product Showcases and Lots of Fun

$
0
0

DEVintersection is coming up! This October 31 – November 2, 2017 at the MGM Grand in Las Vegas, we invite you to join us at Booth 111. Hope to see you there!

Looking forward to DEVintersection 2017? So are we! There are bound to be some amazing announcements. We will be there too (booth #111), so make sure to stop by, meet the team and discuss the latest trends in tech, including our Telerik UI for Xamarin, Telerik UI for UWP, Kendo UI and Telerik Reporting. We have some cool SWAG too.

DEVintersection starts in just a few days and the excitement around the event is growing by the minute. As usual, there are high expectations for the conference with various sessions and talks by some of the biggest names in the industry.

Progress @ DEVintersection: Booth and Sessions

We wouldn’t miss the conference for the world and as usual the cool guys from the Product and Developer Relations teams will be present there. Head over and meet us at Booth 111, where we will have some great product demos, theater sessions and prize giveaways. We'll also be giving out our epic Telerik and Kendo UI T-shirts and a big prize: MICROSOFT XBOX ONE X.

devintersection tshirt

Sessions at Booth 111

Let me reveal a little secret about our product sessions at the booth: We're coming with the very people who personally developed the great advancements in our Telerik and Kendo UI products.

Telerik UI for Xamarin: We are excited to show you our Xamarin UI suite. It is all about beautiful, polished and elegant UI widgets for building cross-platform Xamarin applications. Telerik UI for Xamarin comes complete with predefined item templates for Visual Studio. They are included by default when you install the products. You can directly include them in your Xamarin.Forms project and use them as footprints for similar scenarios in your application.

Kendo UI: We are proud to present the most complete UI library for data-rich web applications with support for your favorite JavaScript technologies – jQuery, Angular, React and Vue. We are pleased to announce new support for React and Vue with our Kendo UI wrappers for these frameworks. You get the same great Kendo UI component features that you have come to rely on, now provided via a wrapper interface for the React and Vue frameworks. 

Telerik UI for UWP– Open Sourced! We are thrilled to provide you with UI for Universal Windows Platform - a complete UI suite for building amazing Windows 10 applications with a single code base. Completely Open Sourced!

Telerik Reporting:We are excited to present you our complete and mature reporting solution. You'll see how to build, style, view and export elegant reports seamlessly and very quickly.

Sessions and Workshops

Meet our visionaries and trend-setters @ DEVintersection:

We'll be There @ DEVintersection!

Looking for us at the conference? Just hunt down our Ninja and Kendoka and our smiling faces will greet you.

.NET DevChat: Responsive Web Apps with ASP.NET MVC and Bootstrap 4

$
0
0

In this .NET DevChat recap, we talk about building responsive web applications with UI for ASP.NET MVC and Bootstrap 4. Dive into the source code and Q&A below.

Bootstrap 4 is great, and it’s even greater when used in conjunction with Telerik UI for ASP.NET MVC.

In this .NET DevChat, we covered the basics of Bootstrap, its NavBar component, the Grid layout system as well as the new and shiny Bootstrap 4 Cards!

We dived right in and added all of these to an ASP.NET MVC application that uses Razor-based Layouts and Views.

We also covered how Telerik’s UI for ASP.NET MVC comes with an out-of-the-box Bootstrap 4-inspired theme so that all the widgets will look as any other Bootstrap styled UI element. In particular, we worked with the Telerik MVC Button, Grid, and Chart.

As promised, here’s the source code for the sample application that we developed during the live webinar.

As usual, we were thrilled to have received great feedback from you in the form of interesting questions!

Questions and Answers

What is the current status on Bootstrap 4?

As of the writing of this post, Bootstrap 4 is on its first Beta release. It had been in alpha for a few months now, but back in August Bootstrap 4 beta came out.

Can I modify the Kendo UI themes to match my company’s branding?

Yes, you can. You can use our Sass ThemeBuilder tool to generate a new theme. You can use the Bootstrap 4 theme as a base and modify from it.

If you are comfortable with Sass you can also modify scss variables to compile a new Kendo theme to use within your MVC application.

What is this Deferred functionality that was used in the demo?

This is a personal preference, and it’s not a requirement.

The reason to use the Kendo MVC Deferred initialization functionality is so that the JavaScript code to initialize the widgets can all go in the same place. Normally, you would put this at the bottom of the page.

Will this work with Telerik UI for ASP.NET Core?

Yes! Since Bootstrap 4 is just CSS, it can be used no matter the server side technology.

In the case of Telerik UI for ASP.NET Core (which supports ASP.NET Core 1 and 2), Razor is also used to generate the MVC widgets, and the actual markup rendered on to the final html page will be the same.

Hence, with the same Razor code all the UI concepts (including Deferred initialization) covered in this webinar will apply on an ASP.NET Core application

Is this type of UI also possible with Angular 4?

Certainly! We also have a webinar where we cover how to write Responsive Angular 4 Dashboards with Kendo UI for Angular.

Need a DataGrid for Your UWP App?

$
0
0

DataGrids are critical in most business apps. Why reinvent the wheel when you can use the high-performing and open source Telerik UI for UWP DataGrid instead?

Building a Windows 10 app using the Universal Windows Platform? Chances are you’ll need a DataGrid for your application, and what a better choice than the highly-performant and feature rich DataGrid from the Telerik UI for UWP suite, which is also open source and available on GitHub.

As we all know, Grids are the backbone of most line of business applications out there. They are also by far one of the hardest components to create in terms of development time, functionalities, customization, responsiveness and speed.

Developers need to be able to deliver large applications tailored to the needs of the business and following the project requirements on tight deadlines. This means quite often they must choose between building the component internally or using a third-party toolkit, which provides it out of the box.

But you already know all of this, right? So where am I going with this blog?

Well, let me cut to the chase. If you had the pleasure to attend this year’s Microsoft Build Day 2 keynote, either in person or virtually, you were probably thrilled by the announcement about XAML Standard 1.0. Abolade Gbadegesin (Architect for Project Rome) presented on the Microsoft team’s work on improving the Pen capabilities and showcased them with the Telerik UI for UWP DataGrid on stage (57:35). 

So why should you choose the Telerik UI for UWP DataGrid? Well, for starters, if you missed it, as of February 2017 the whole Telerik UI for UWP suite is open sourced. Yes, this includes the DataGrid, meaning you are more than welcome to use it in your Windows 10 application. You can get the whole product package from GitHub and start using it right away. However, there is more to a component than its free availability.

Telerik UI for UWP DataGrid—Benefits and Functionalities

Telerik UI for UWP Grid Overview

The Telerik UI for UWP DataGrid is an extremely powerful component in terms of both speed and functionality. It has been built from the ground up to deliver maximum performance and a native look and feel to your Windows 10 app. It provides advanced UI virtualization for high performance making the grid fast, fluid and responsive and capable of processing huge amounts of data blazing fast.

In addition, the DataGrid offers the ability to customize columns, through templates for the different cell types, as well to manually or automatically adjust their width depending on the content they include. This comes quite handy when one of your columns includes cells with visualizations or long strings of data. On the other hand, for columns consisting of icons, up-down arrows signifying increase/decrease, or other smaller objects, they can be scaled down to a smaller size providing better visualization of all the data in a certain row.

Another key feature that our DataGrid offers is the ability to sort single and/or multiple columns in either ascending or descending values, resulting in users being able to sort data with a single tap on the column header. These not only includes alphabetical sorting, but also numbers, values (True/False) and duration.

Sorting Telerik UI for UWP

A well known and highly used functionality of any grid is the filter. With the filtering feature in the Telerik UI for UWP DataGrid your users will be able to filter ANY type of data, be it string, decimal, Boolean or date and time. There are also various filtering functionalities to further extend the capabilities of the control. For example, you can filter by:

  • is/no equal/great/less than
  • before and after
  • Contains/StartsWith/EndsWith

The rich API behind the control allows you to easily define the advanced filtering criteria through the code and suit it to the project requirements you are working with.

Here are a few other features that the component includes:

  • Cell or Row, Single or Multiple Selection
  • Grid Filtering customization
  • Grouping—users will be able to group data by simply moving a column header to the dedicated grouping panel

Filter Telerik UI for UWP

Verdict

All and all, the Telerik UI for UWP DataGrid is a truly advanced component, which can serve you well in developing Windows 10 applications, while also cutting down your development time substantially.  The extensive documentation will decrease your learning time and will get you running in a jiff. If you are interested in learning more on add a Grid to your current application, check out this blog post on Getting Started with Telerik UI for UWP, where John Bristowe will guide you through creating an application and using the DataGrid and Chart components.

Should you require support during your development, check out our fully supported version Telerik UI for UWP and test it out in a one-month free trial.

Otherwise, get the full project and source code from our GitHub repository and you are welcome to star or fork our project. We love it when people mess with our code and find issues with it (or not ).

Happy coding!

Build Accessibility-Compliant Reports with Telerik Reporting

$
0
0

Producing accessible reports is essential for businesses that reach out to a wide audience. Telerik Reporting is ready to provide this valuable feature.

In this article, I will write about an often neglected, yet really important component of modern web applications—accessibility. When your business needs to reach a broader audience, it is vital to produce documents that are available for all users. This includes the people with motor control restrictions who experience difficulties working with a mouse or trackball, and the ones that need to use additional assistive technologies like screen readers to interpret the document content.

Fortunately, there are well-known standards and guidelines that specify how to make a document accessible. In the R3 2017 release of our product, we introduced accessibility support for our HTML5-based viewers, following the recommended practices from Section 508 of the Rehabilitation Act and Web Content Accessibility Guidelines (WCAG) 2.0. Now our users can effortlessly add accessible reports to any flavor of web applications that we support, producing content according to standards set by the WAI-ARIA specification. The process involves providing accessibility support for both report viewer and report content.

Accessible Report Viewer

The Report Viewer is the widget that allows users to preview the report and interact with the reporting engine when changing the parameters, browsing through the report pages or navigating in the document map. It now provides an option that switches its accessibility mode on or off. When the accessibility mode is enabled, the viewer activates the keyboard support, starts emitting dynamically generated descriptions for non-text items and instructs the reporting engine to render the reports according to the accessibility standards mentioned above.

Keyboard Support

Every part of the report viewer is dedicated to a different task. Based on that, it can be separated into four main areas:

  • Content—this is the main area where the currently rendered report is displayed
  • Menu—the menu bar that is used to navigate forth and back in history, go to a certain page and execute commands on the rendered report, like printing, exporting, etc.
  • Parameters—the panel where the report parameters (if any) are displayed, so the user can change them and preview the report with the new values
  • Document map—a tree view that reflects the report structure, providing a set of navigational links to the report items in the rendered report

In accessibility mode the viewer labels the areas as landmarks and allows using shortcut keys to directly focus on them and navigate within their content—menu buttons, parameter editors and document map nodes. When a report is rendered in accessibility mode, its content is marked as focusable and can be traversed with the keyboard. The keyboard can also be used to execute an interactive action if the focused report item has one set.

Dynamically Generated Descriptions

When the accessiblity mode is enabled, the focusable elements in the viewer areas provide labels that can be read by an assistive technology like a screen reader.

The menu area sets labels on its buttons and submenus, explaining the function they execute and their current state (enabled or disabled). The parameter area provides information about the parameters it contains, as does each parameter editor about its type, currently selected value and (if needed) a validation message. The document map area generates labels for its nodes so the screen reader can inform the user which navigational link currently has focus.

Accessible Report Content

When designing a report using Visual Studio or Standalone Report Designer, the user can provide additional information about every report item, setting an expression for its AccessibleDescription property. The evaluated expression will produce a WAI-ARIA compliant attributes, but it will be respected only when the report viewer has its accessibility mode enabled, so no redundant markup will be generated. This property is extremely useful when the report contains a non-textual item like a PictureBox or Graph, and helps provide valuable information to the user about the currently focused element.

By default, if the AccessibleDescription value is not set, the report item will produce an accessible label, based on its Value property, which would cover the most scenarios and no report refactoring will be needed. Additionally, the engine concatenates some meta information, related to the current report item, so the user will be given as much detail as possible. 

For example, if the report contains a table, its accessible label will automatically be appended with information about the rows and columns count. Each of the table cells will emit information about its position in the table—whether it is a header cell, and on which row and column it is placed. So if a report contains a TextBox with Value = "Sorts by Category," that performs a sorting action and is nested in a table's first (header) row and third column, the generated label value will be: Text box. Performs a sorting action. Column header. Column two, row zero. Sorts by Category.

Customization

The HTML5-based report viewers accessibility mode is disabled by default, so no excessive HTML markup will be generated. It can be set through the report viewer’s initialization script, using the enableAccessibility(true) option. When adding a report viewer to a project with the Item Template Wizard, its last page suggests setting the accessibility mode and generates the required option automatically. The texts, generated by the accessibility module, can be localized easily, and the default shortcut key mapping can be changed if it interferes with the default browser behavior.

Want to Learn More?

Having a report tool that produces content to meet accessibility standards can be a great benefit when striving to provide the best solution for the most people. The Telerik Reporting team at Progress will continue our efforts to introduce the accessibility support for the entirety of technologies covered by our report viewers. If you would like to learn more about the process, take a look at the new features, check the product roadmap or try it yourself for free!

Get Reporting in our Bundles

You can get Telerik Reporting as an individual product or as a part of our bundles. We bring the best of Telerik and Kendo UI together in convenient bundles, including a wide-range of UI, reporting and productivity tools for both .NET and JavaScript technologies and support that’s got your back in every step of your project. Thanks to our intuitive APIs, alongside thousands of demos with source code availability, comprehensive documentation and a full assortment of VS templates you will get up and running with our tools in no time and fully embrace your inner warrior (Kendoka/Ninja).

By leveraging the broad array of themes, skins, styling and customization options, your application will awe even the best front-end designers. Check it out!

Viewing all 1954 articles
Browse latest View live


Latest Images